16.2.22 UTAP: Transcriptome from RNA-Seq, MARS-Seq or SCRB-Seq
Analysis setup
The transcriptome pipelines run on the Wexac cluster. In order to run a new transcriptome analysis, your fastq files must be in your Collaboration folder on Wexac, in the correct structure (UTAP requirements & description) .
To run a new analysis from existing files in the Collaboration folder login to http://utap.wexac.weizmann.ac.il using your Weizmann userID and password and click on "Run pipeline":
This page concentrates on the common aspects of the RNA-Seq, MARS-Seq or SCRB-Seq pipelines.
A. Select the pipeline you desire
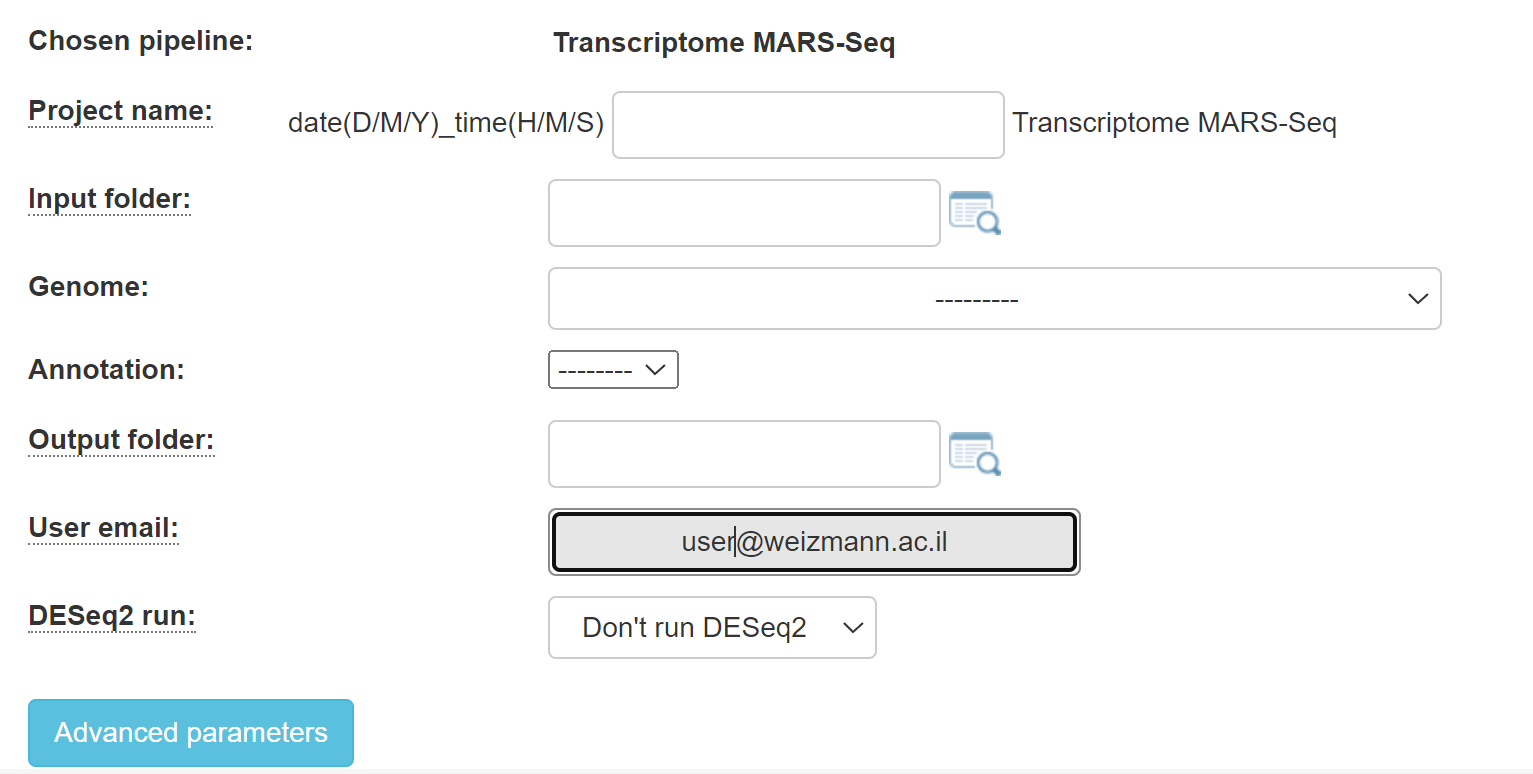
1. For MARS-Seq, you will get this screen:
2. For RNA-seq, you will get this screen:
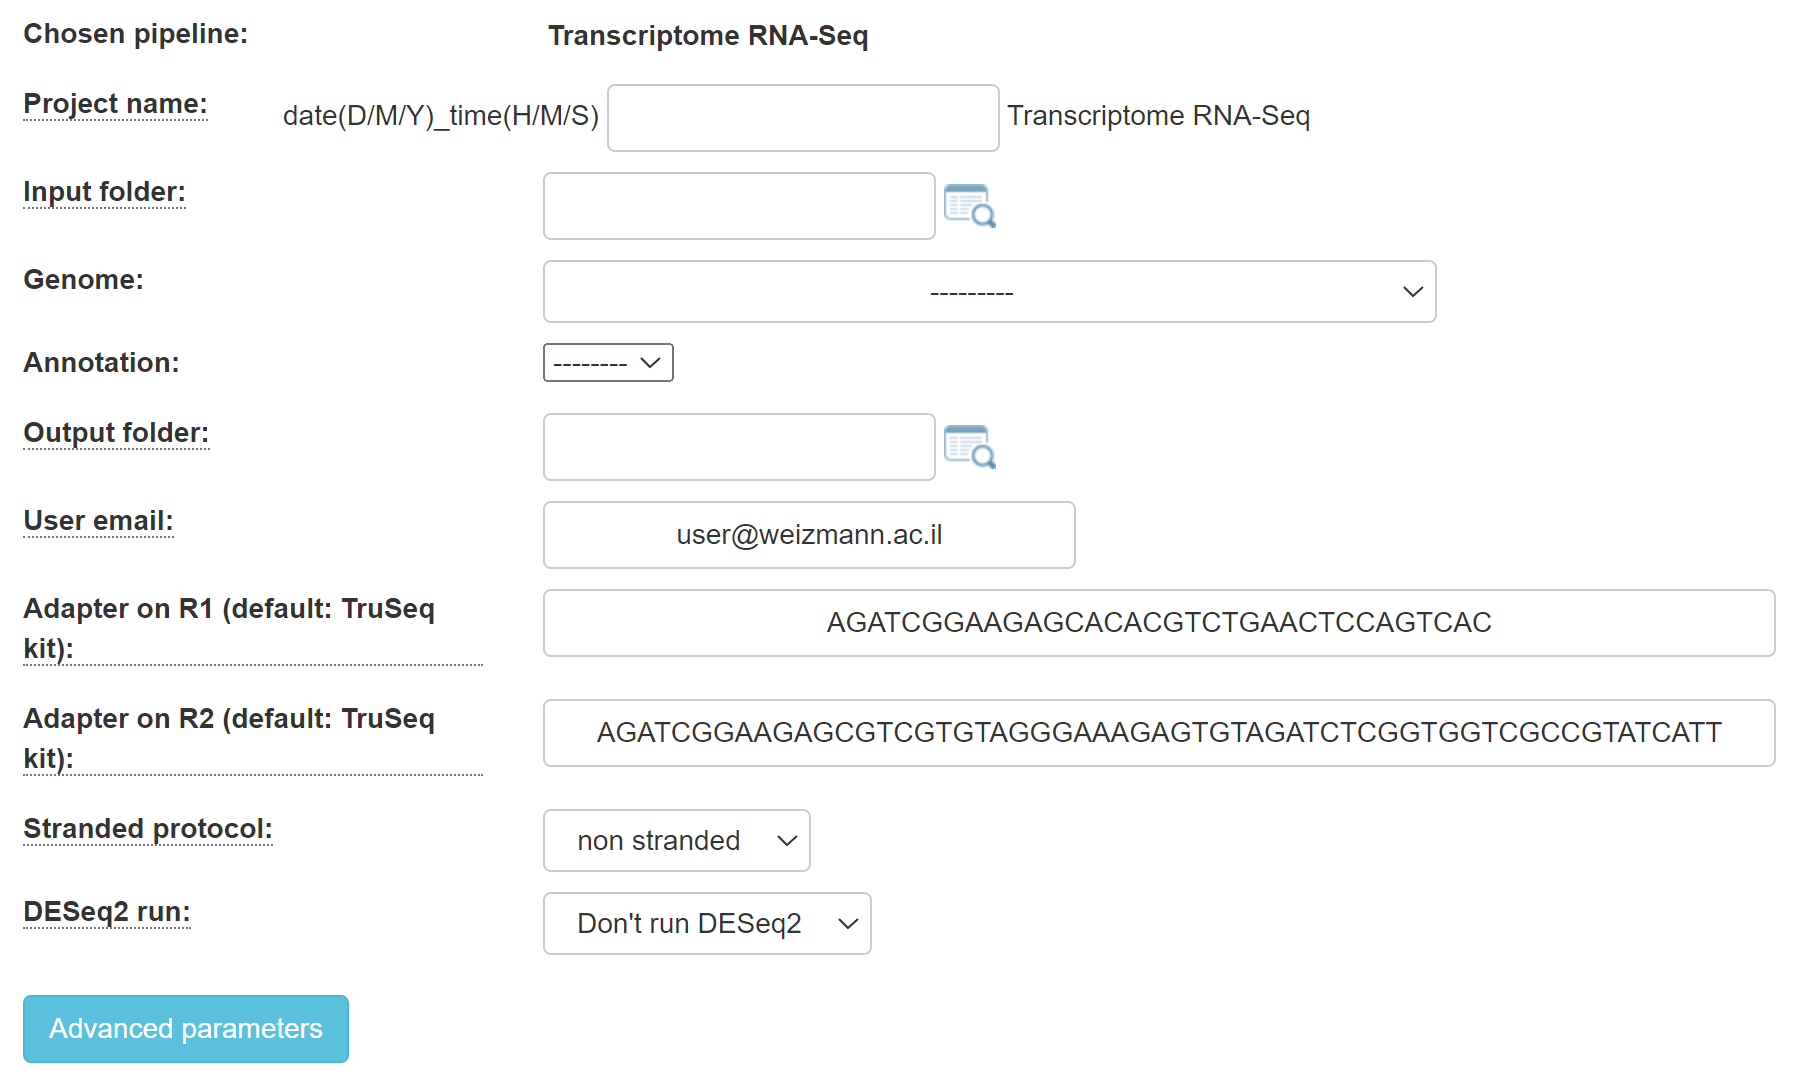
Select whether or not your protocol is stranded (the sequenced reads saves the original strand of RNA fragments) or non-stranded.
Specify your adapters for each read (R1 and R2). These adapters will be removed from the reads by the pipeline. The default adapters are the Illumina compatible TruSeq i5 and i7 adapters.
3. For SCRB-Seq, you will get this screen: - will be added
B. Define additional parameters for the pipeline
Fill in the project name, select the genome and annotation.
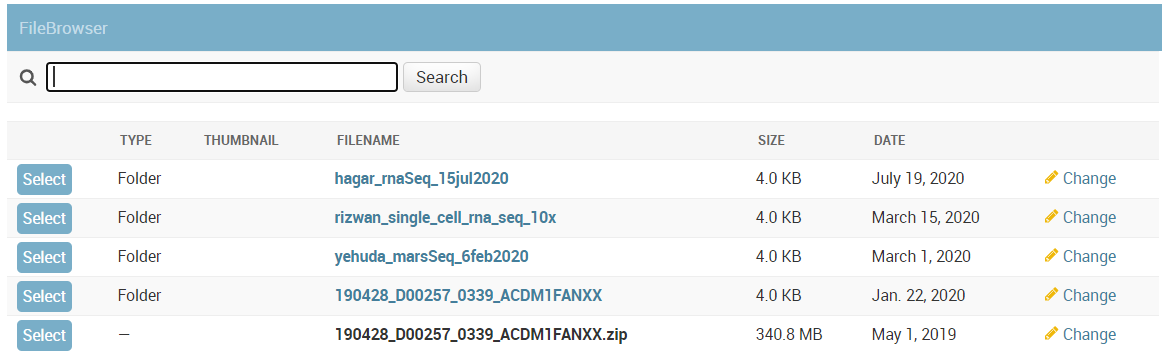
Browse within your Collaboration directory structure and Select the root folder of the sub-folders of the samples for analysis with the appropriate button.
Note that if you wish to go up one level (or more), please click the desired folder level on the path at the top of the window.
If there is an error with the folder you selected, you must fix it in order to run the pipeline.
Select the desired output folder.
Continue by filling in all of the fields.
C. Select DESeq2 options for the statistical analysis
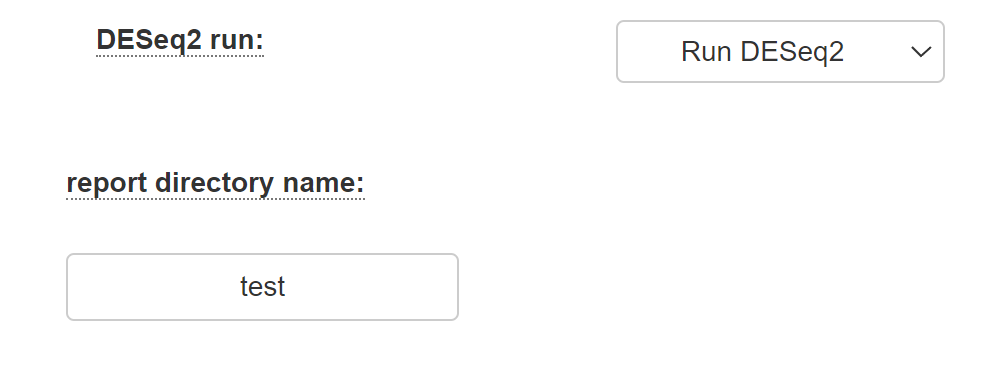
Select "Run DESeq2" if you desire to identify differentially expressed genes using the DESeq2 package as described in the DESeq2 manual. If you select this option, al least two categories must be defined (by filling in the category names).
Associate each sample to a category, use the arrows to move the sample to the appropriate category.
You may add additional categories by using the relevant buttons.
If the samples were prepared in different batches, you can add this information: After moving the samples into categories boxes, click on the "Add Batch Effect" button, then select the samples that belong to one batch and click on the "Batch 1" button. Repeat the operation with the other groups of the samples.
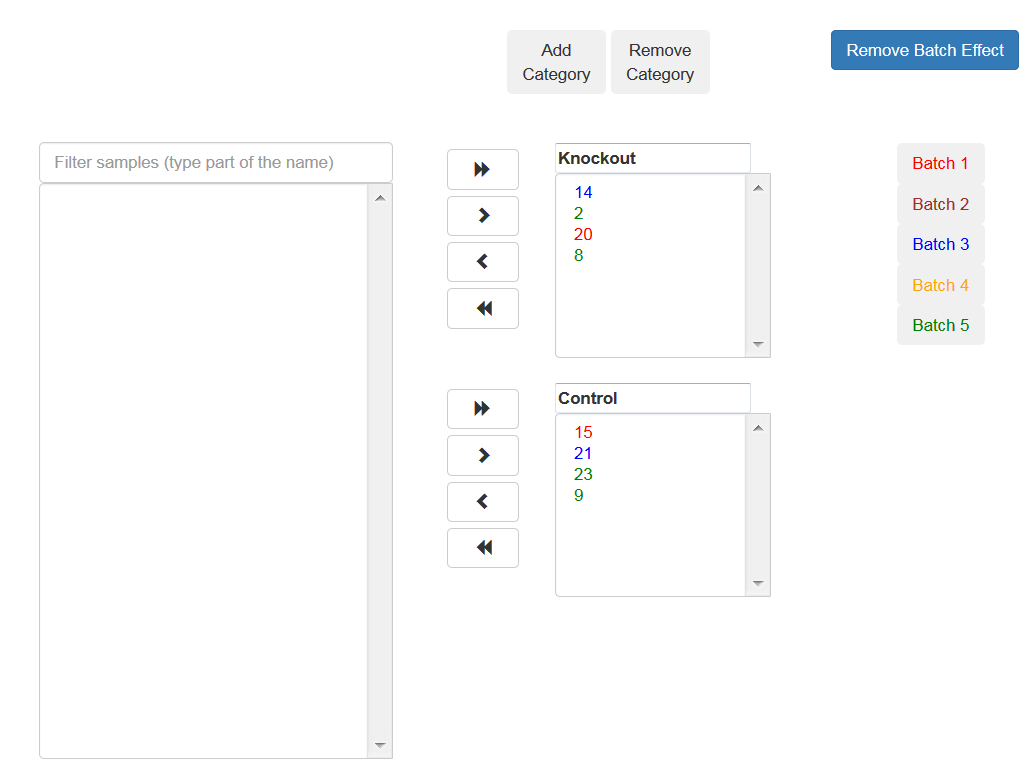
All the steps of the pipeline (mapping, counts etc.) will be run on all of the samples, except for DESeq2 which will be run only on the samples with categories.
Finally, submit the run for analysis.
Analysis pipeline steps and reports
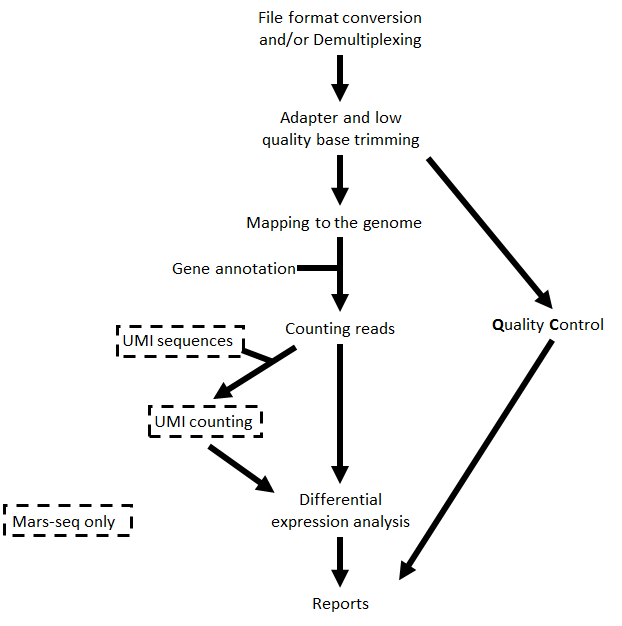
The steps performed by the pipeline include:
- Trim adapter sequences
- Fastqc for quality control of the samples (run in parallel with the other steps)
- Map reads to the selected reference genome
- When the protocol is MARS-Seq, add UMI and gene information to the reads
- Quantify gene expression by counting reads
- When the protocol is MARS-Seq and DESeq2 is selected, count UMIs to correct for PCR duplications.
- Detect Differentially Expressed (DE) genes for a model with a single factor
Steps 4 and 6 are performed only for MARS-Seq
Upon completion, you will get an email with links to the results report. For an interactive detailed explanation of the report use the relevant e-learning module.
The report includes several sections:
- Sequencing and Mapping QC
- Figure 1 - Plots the average quality of each base across all reads. Qualities of 30 (predicted error rate 1:1000) and up are good
- Figure 2 - Histogram showing the number of reads for each sample in the raw data
- Figure 3 - Histogram showing the percent of reads discarded after trimming the adapters (after the removing of the adapters, some read and polyA/T or low quality reads may be too short; the pipeline discards them)
- Figure 4 - Histogram with the number of reads for each sample in each step of the pipeline
- Figure 5 - Plots showing sequence coverage on and near gene regions
- Figure 6 -
- Histogram showing the percent of reads that mapped uniquely and not uniquely per sample
- Histogram showing the percent of the uniquely mapped reads that mapped to genes (genes included must have at least 5 reads)
- Exploratory Analysis
- Figure 7 - Heatmap plotting the highly-expressed genes (above 5% of total expression). For example the expression of gene RN45S in sample SRR3112243 amounts to 15% of the expression
- Figure 8 - Heatmap of Pearson correlation between samples according to the gene expression values
- Figure 9 - Clustering dendrogram of the samples according to the gene expression
- Figure 10 - PCA analysis
- Histogram of % explained variability for each PC component
- PCA plot of PC1 vs PC2 c. PCA plot of PC1 vs PC3
- Differential Expression Analysis (this section exists only if you run the DESeq2 analysis) - a table with the number of differentially expressed (DE) genes in each category (up/down) for the different contrasts. In addition, links for p-value distribution, volcano plots and heatmaps, as well as a table of the DE genes with dot plots of their expression values
- Bioinformatics Pipeline Methods - description of the utilized pipeline methods
- Links to additional results - links for downloading tables with raw, normalized counts, log normalized values (rld) and statistical data of contrasts. In the case of model with batches, "combat" values are calculated (instead of rld) using the "sva" package, and are batch corrected normalized log2 count values.
Annotation file:
For the counts of the reads per gene we use with annotation files (gtf format) from RefSeq or GENCODE (more elaborate i.e. contains more genes and transcripts) . In MARS-Seq analysis we use a modified version of the gene that includes 1000 bp upstream of the TES (transcription end site) on the transcript and 100 bp downstream of the TES.
Please regard this analysis as a good starting point and not an end result.
LINK:
Transcriptome pipeline for Weizmann Institute users: http://utap.wexac.weizmann.ac.il
Acknowledgments
Citation:
Kohen et al. BMC Bioinformatics (2019) 20:154 https://doi.org/10.1186/s12859-019-2728-2 (PMID: 30909881)
Bioinformatics support staff for UTAP:
- UTAP development and maintenance team: utap@weizmann.ac.il
- Dena Leshkowitz
- Ester Feldmesser
- Gil Stelzer
- Bareket Dassa
- Noa Wigoda