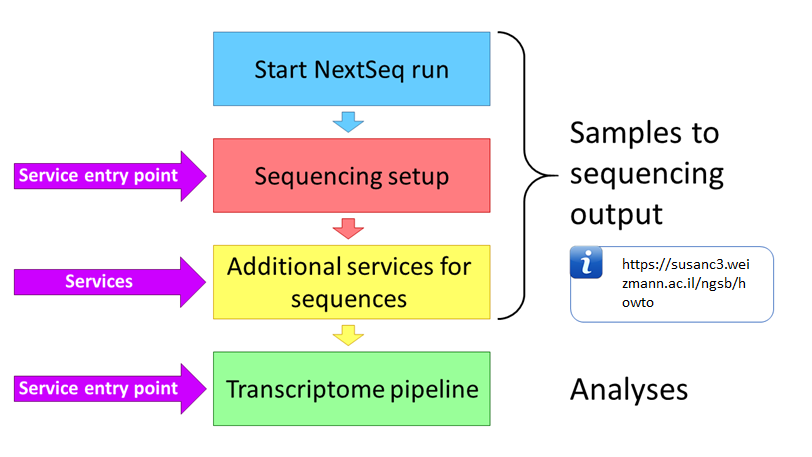
The bioinformatics unit provides several services for obtaining NGS data. The entire process can be divided into 2 main steps -
...
Anchor Additional services for sequences Additional services for sequences
Additional services for sequences
| Additional services for sequences | |
| Additional services for sequences |
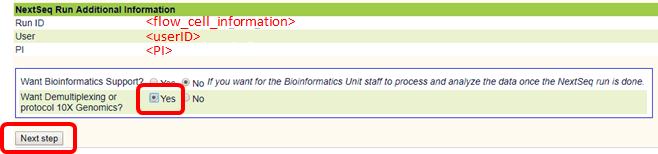
In order to use post-sequencing services, such as demultiplexing and quality control please select these services as appears below
If you wish demultiplexing and quality control services, you are required to upload a sample sheet to the SusanC3 server 5 minutes (at least) after a NextSeq machine has begun running and before sequencing has completed. The sample sheet must be prepared in a format (csv or xlsx) corresponding to one of three experiment protocols -
- Illumina compatible indexing (TruSeq RNA-Seq and others) - SampleSheet.csv (example)
- Mars-Seq - Mars-seq_users.xlsx (example)
- 10x Genomics (single cell RNA-Seq) - SampleSheet.csv (example). Note: Leave the Lane column empty (unless you know what your'e doing)
We recommend you test the sample sheet format here. The same sample sheet may contain samples for several users which should be detailed within the file.
DO NOT mix protocols on a run.
Note: Valid characters for sample names are A-Z a-z 0-9 . _ -
Do NOT use special characters such as " ' ` ? , ; + = @ # $ % ^ & () [] {} <> / \ in sample names.
Do NOT use Hebrew, Arabic, Chinese or any character-set other than English (Roman alphabet)

The sample sheet will be analyzed and you may add notes at this stage
...
In order to run a transcriptome analysis your lab must have -
- An account on Wexac
- Sufficient free storage space (> 400Gb)
- A "Collaboration" folder with read and write permissions for the Bioinformatics Unit (LSCF - Life Science Core Facility)within your lab folder
Requirements 1 and 2 may be setup by your administrator. Requirement 3 must be setup by the computing center (hpc@weizmann.ac.il).
In addition you must have a userID on Wexac, which may be setup by your administrator.
Anchor Analysis setup BEFORE sequencing completion Analysis setup BEFORE sequencing completion
| Analysis setup BEFORE sequencing completion | |
| Analysis setup BEFORE sequencing completion |
Analysis setup BEFORE sequencing completion
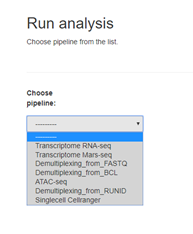
Transcriptome analysis of sequencing results that immediately follows demultiplexing and quality control can be setup at the first entry point (after uploading a sample sheet).
In the final step of this setup process please click "Run pipeline" for setting up the transcriptome pipeline
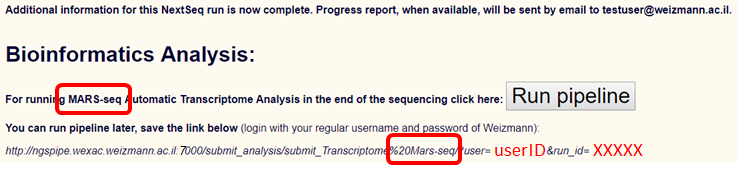
You may also save the link (the parameters will change according to the uploaded sample sheet) as appearing above if you wish to run the pipeline at a later time.
...
| Anchor | ||||
|---|---|---|---|---|
|
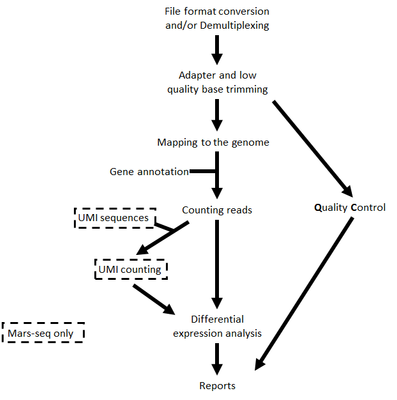
The steps performed by the pipeline -
- Trim adapter sequences
- Fastqc for quality control of the samples will be run in parallel to the steps described
- Map reads to the selected reference genome
- Add UMI and gene information to the reads
- Quantify gene expression by counting reads
- Count UMI's to aviod PCR duplications
- Detect Deferentially Expressed (DE) genes for a model with a single factor
Steps 4 and 6 are performed only for Mars-Seq
Steps 6 is performed only if DESeq2 is selected
Upon completion you will get an email with links to the results report
The report includes several sections -
- Sequencing and Mapping QC
- Figure 1 - Plots the average quality of each base across all reads. Quality of 30 (predicted error rate 1:1000) and up is good
- Figure 2 - Histogram showing the number of reads for each sample in raw data
- Figure 3 - Histogram showing the percent of reads discarded after trimming the adapters (after the removing of the adapters some read and polyA/T or low quality reads may be too short and the pipeline discards them)
- Figure 4 - Histogram with the number of reads for each sample in each step of the pipeline
- Figure 5 - Plots sequence coverage on and near gene regions
- Figure 6 -
- Histogram showing the percent of reads that mapped uniquely and not uniquely per sample
- Histogram showing the percent of the uniquely mapped reads that mapped to genes (genes included must have at least 5 reads)
- Exploratory Analysis
- Figure 7 - Heatmap plotting the highly-expressed genes (above 5% of total expression). For example the expression of gene RN45S in sample SRR3112243 amounts to 15% of the expression
- Figure 8 - Heatmap of Pearson correlation between samples according to the gene expression values
- Figure 9 - Clustering dendogram of the samples according to the gene expression
- Figure 10 - PCA analysis
- Histogram of % explained variability for each PC component
- PCA plot of PC1 vs PC2 c. PCA plot of PC1 vs PC3
- Differential Expression Analysis (this section exists only if you run the DESeq2 analysis) - a table with the number of differential expressed genes (DE) in each category (up/down) for the different contrasts. In addition, links for p-value distribution, volcano plots and heatmaps as well as a table of the DE genes with dot plots of their expression values
- Bioinformatics Pipeline Methods - description of pipeline methods utilized
- Links to additional results - links for downloading tables with raw, normalized counts, log normalized values (rld) and statistical data of contrasts. In case of model with batches, "combat" values were calculated (instead of rld) using "sva" package and are batch corrected normalized log2 count values.
Annotation file:
For the counts of the reads per gene we use with annotation files (gtf format) from "ensemble" or "gencode". In MARS-seq analysis we extend the 3' UTR exon away from the transcript on the DNA and extend or cut the 3" UTR exon towards the 5' direction on the mRNA.
...
https://bip.weizmann.ac.il/mars-seq
Please regard this analysis as a good starting point and not an end result.
Other pipelines available through UTAP:
See : ATAC-Seq manual
List of links-
Pipeline nextseq:
...