Copy of UTAP requirements, setup, and reports (Weizmann users) - (under construction : MT/MS)
UTAP: User-friendly Transcriptome Analysis Pipeline
In order to run a transcriptome analysis, your lab must have:
- An account on Wexac
- Sufficient free storage space (> 400Gb)
- A "Collaboration" folder within your lab folder, with read and write permissions for the LSCF (Life Science Core Facility) Bioinformatics Unit
Requirements 1 and 2 can be set up by your department secretary or administrator. Requirement 3 must be set up by the computing center (contact hpc@weizmann.ac.il).
Analysis setup BEFORE sequencing completion
Transcriptome analysis of sequencing results that immediately follows demultiplexing and quality control can be set up at the first entry point (after uploading a sample sheet).
In the final step of this setup process, please click "Run pipeline" to set up the transcriptome pipeline
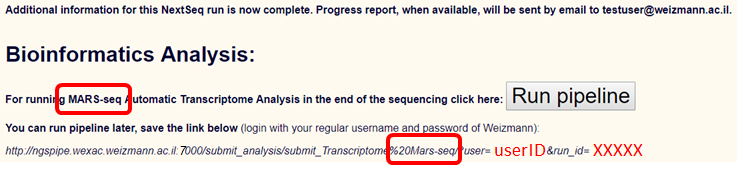
You may also save the link (the parameters will change according to the uploaded sample sheet) as appears above if you wish to run the pipeline at a later time.
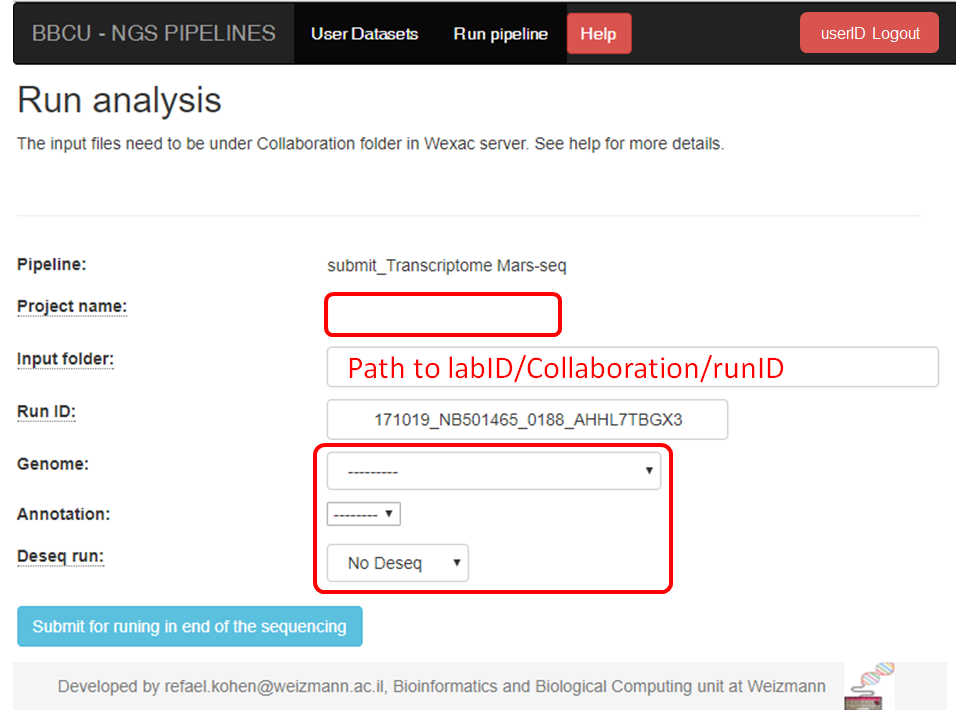
Fill in the project name, select the genome and annotation.
If your protocol is RNA-seq, you will get this screen:
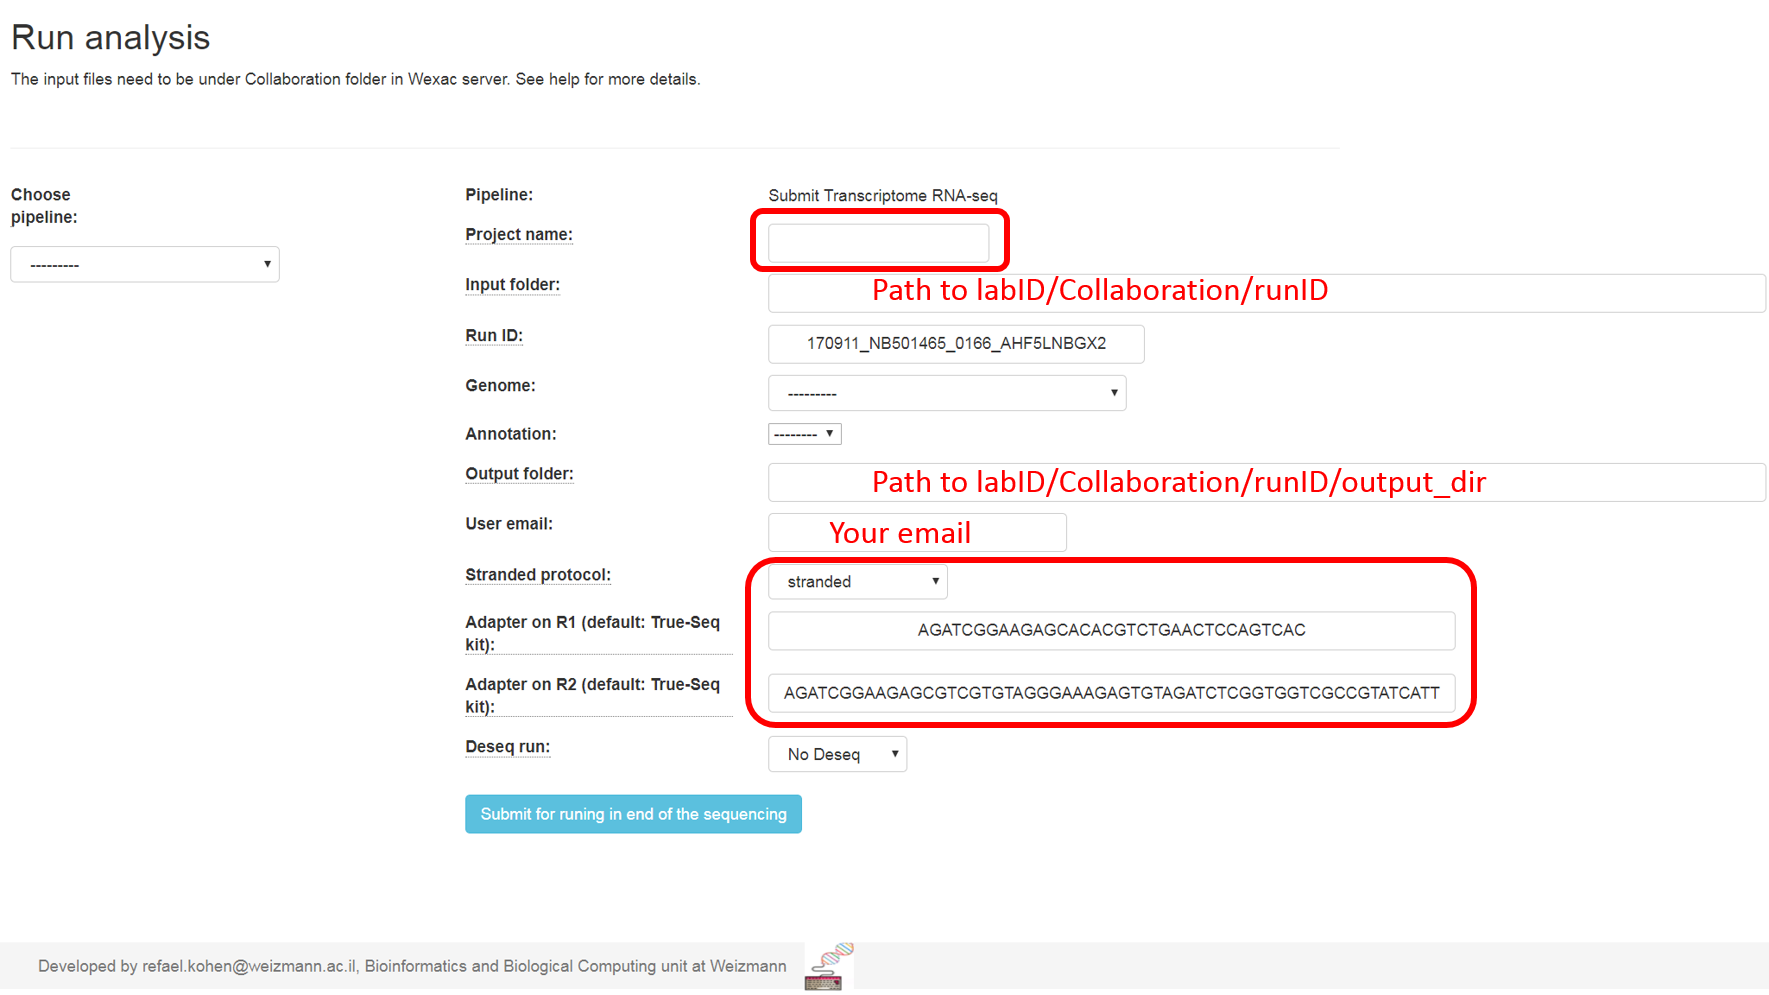
Fill in the project name, select the genome and annotation.
Select whether or not your protocol is stranded (the sequenced reads saves the original strand of RNA fragments) or non-stranded. If you don't know, select the "find automatically" option.
Specify your adapters for each read (R1 and R2). These adapters will be removed from the reads by the pipeline. You can retain the default adapters if you use them with P5 and P7 adapters of the True-seq protocol.
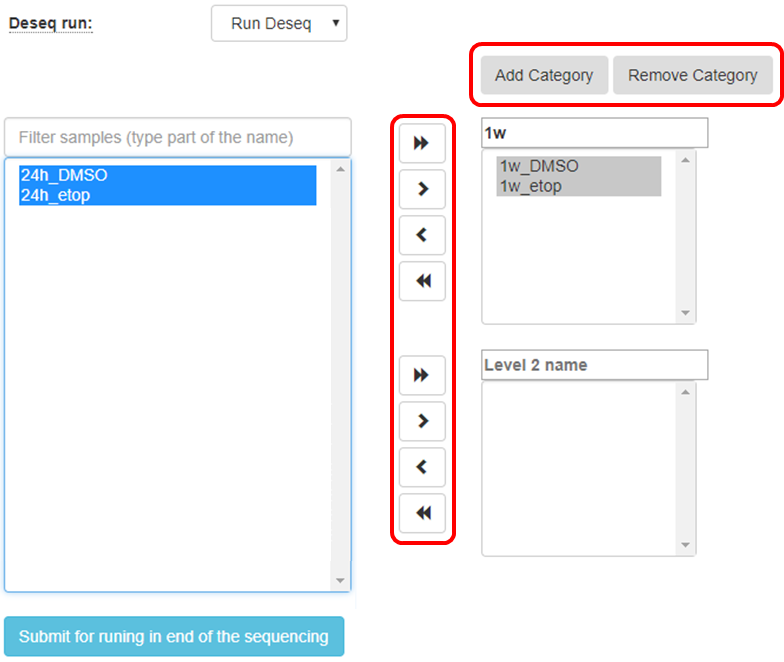
Select whether or not you desire to identify differentially expressed genes using the DESeq2 package as described in the DESeq2 manual. If you select this option, by default, two categories must be created (by filling in the category names).
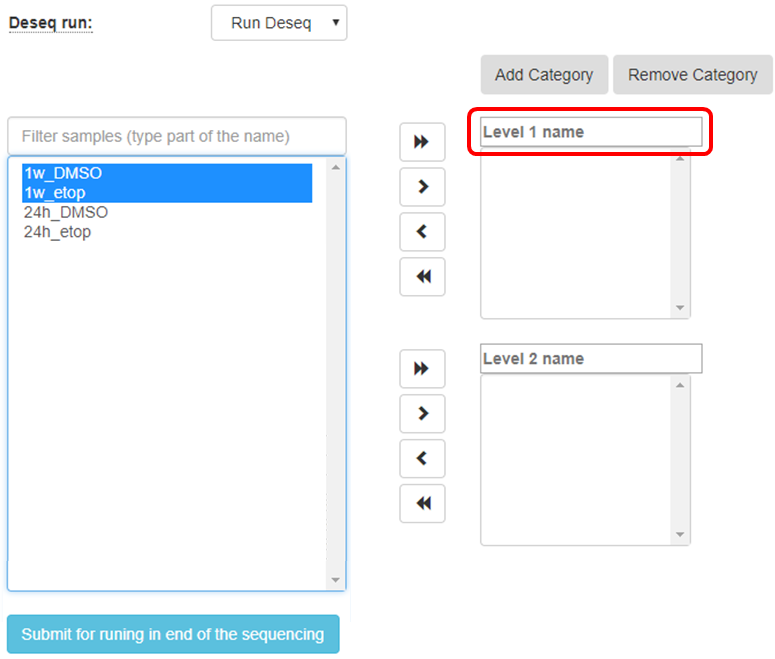
Sort the samples by selecting them and using the arrows to move to the appropriate categories
You may add additional categories by using the relevant buttons
If the samples were prepared in different pools, you can add this information: After moving the samples into categories boxes, click on the "Add Batch Effect" button, then select the samples that belong to one batch and click on the "Batch 1" button. Repeat the operation with the other groups of the samples.
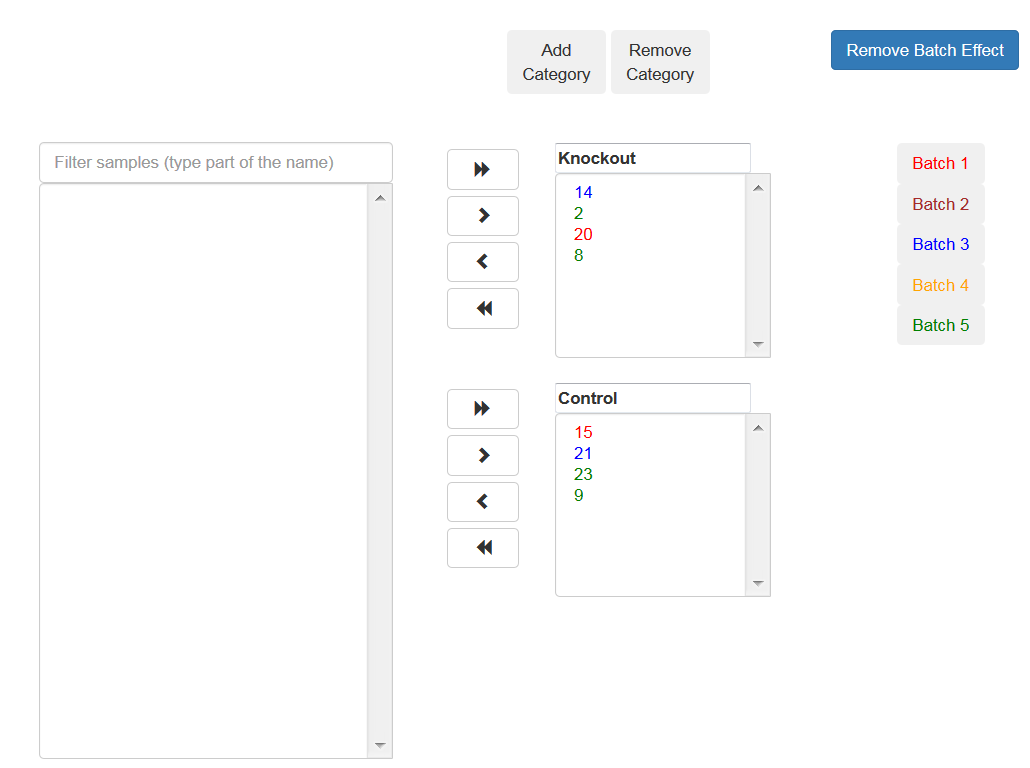
All steps of the pipeline (mapping, counts etc.) will be run on all of the samples, but Deseq will be run only on the samples with categories.
Finally, submit the run for analysis. When sequencing has completed, the files will be copied from the Stefan (temporary) server to the Collaboration folder within your lab folder on Wexac, and analysis will be executed as specified.
Analysis setup AFTER sequencing completion
The pipeline website: http://ngspipe.wexac.weizmann.ac.il:7000
The transcriptome pipelines run on the Wexac cluster. In order to run a new transcriptome analysis, you must first transfer demultiplexed sequencing data (fastq files) to your Collaboration folder on Wexac. If you set up the transcriptome analysis as described above after uploading a sample sheet, your demultiplexed fastq files will be automatically copied to the appropriate Collaboration folder in your lab's Wexac account. Within the Collaboration folder, a directory structure will be created according to the transcriptome analysis setup.
If you wish to run an analysis AFTER sequencing has completed using the link provided in the email you received (after demultiplexing and QC finish), paste the link in a browser. Then, simply set up the analysis (enter project name, create categories etc) and the files will be copied for you to your collaboration folder on Wexac as described above.
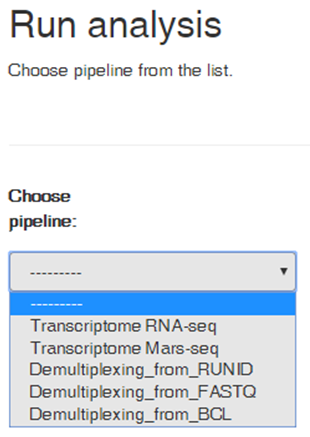
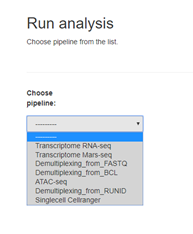
If you wish to run a new analysis from existing files in the Collaboration folder, or if you uploaded data to Wexac from an external source (e.g. sequencing data not performed in the LSCF) login to http://ngspipe.wexac.weizmann.ac.il:7000 using your Weizmann userID and password and click on "Run pipeline"

Select the pipeline you desire
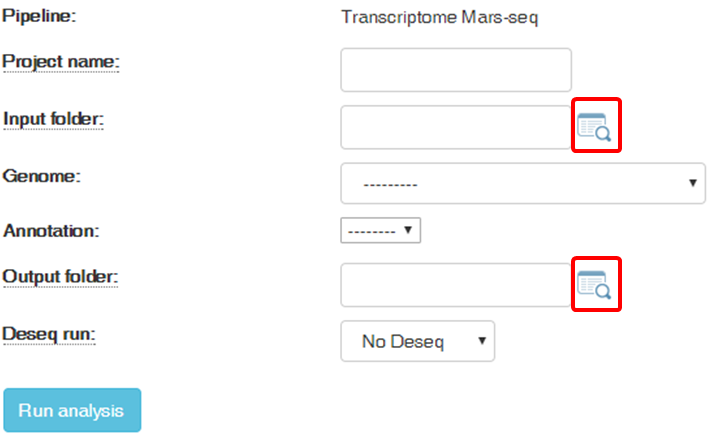
Browse within your Collaboration directory structure and Select the root folder of the sub-folders of the samples for analysis with the appropriate button. Note that if you wish to go up one level (or more), please click the desired folder level on the path at the top of the window.
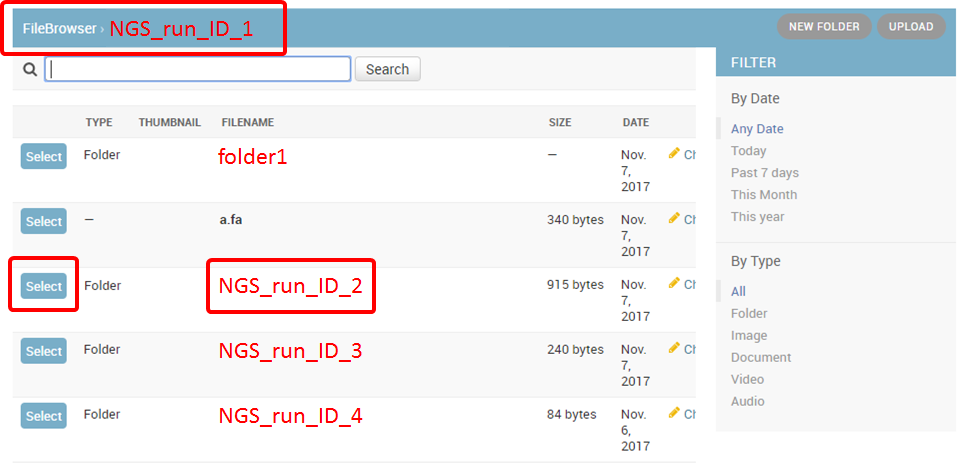
Fastq files must be organized, within the selected folder (root folder), into subfolders as shown below. The subfolders names are derived from the sample names.
Fastq files must start with the same sample name as the subfolders and end with "_R1.fastq" (or "_R1.fastq.gz") for single-read data. In the case of paired-end data (required for Mars-Seq), corresponding files must exist that are IDENTICAL in their name except for the ending "_R2.fastq" (or "_R2.fastq.gz") instead of "_R1.fastq".
For example:
- root_folder
- sample1
- sample1_R1.fastq
- sample1_R2.fastq (must exists in Mars-seq and in paired-end)
- sample2
- sample2_R1.fastq.gz
- sample2_R2.fastq.gz (must exists in Mars-seq and in paired-end)
- sample1
The pipeline also supports the convention of the fastq file format _S*_L00*_R1.fastq or _S*_L00*_R1_0*.fastq.
For example:
- root_folder
- sample1
- sample1_S0_L001_R1_001.fastq
- sample1_S0_L001_R1_002.fastq
- sample1_S0_L002_R1_001.fastq
- sample1_S0_L002_R1_002.fastq
- sample1_S0_L001_R2_001.fastq (must exist in Mars-seq and in paired-end)
- sample1_S0_L001_R2_002.fastq (must exist in Mars-seq and in paired-end)
- sample1_S0_L002_R2_001.fastq (must exist in Mars-seq and in paired-end)
- sample1_S0_L002_R2_002.fastq (must exist in Mars-seq and in paired-end)
- sample2
- sample2_S0_L001_R1_001.fastq
- sample2_S0_L001_R1_002.fastq
- sample2_S0_L002_R1_001.fastq
- sample2_S0_L002_R1_002.fastq
- sample2_S0_L001_R2_001.fastq (must exist in Mars-seq and in paired-end)
- sample2_S0_L001_R2_002.fastq (must exist in Mars-seq and in paired-end)
- sample2_S0_L002_R2_001.fastq (must exist in Mars-seq and in paired-end)
- sample2_S0_L002_R2_002.fastq (must exist in Mars-seq and in paired-end)
- sample1
If there is an error with the folder you selected, you must fix it in order to run the pipeline.
The output folder should be different from the one automatically filled in (based on the selected input folder).
Select the desired output folder.
Continue by filling in all of the fields; if you select to run DESeq2, create categories and sort the samples accordingly, as shown in analysis setup BEFORE sequencing completion.
Finally, submit the run.
Analysis pipeline steps and reports
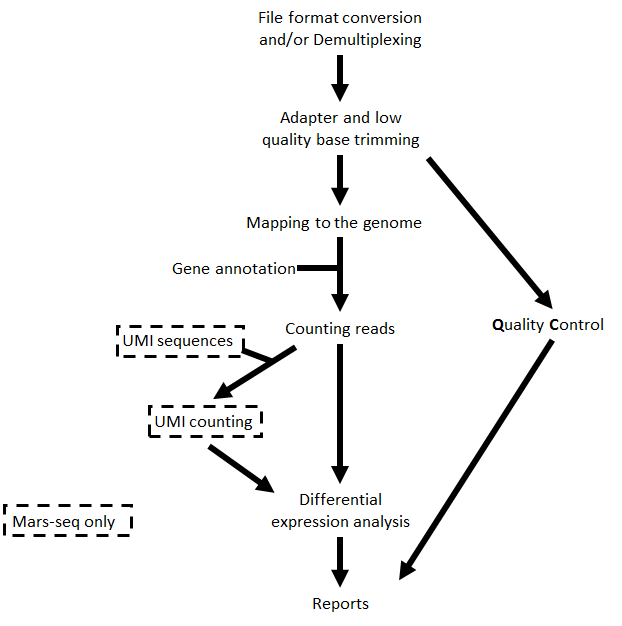
The steps performed by the pipeline include:
- Trim adapter sequences
- Fastqc for quality control of the samples (run in parallel with the other steps)
- Map reads to the selected reference genome
- Add UMI and gene information to the reads
- Quantify gene expression by counting reads
- Count UMI's to avoid PCR duplications
- Detect Differentially Expressed (DE) genes for a model with a single factor
Steps 4 and 6 are performed only for Mars-Seq
Step 6 is performed only if DESeq2 is selected
Upon completion, you will get an email with links to the results reports
The report includes several sections:
- Sequencing and Mapping QC
- Figure 1 - Plots the average quality of each base across all reads. Qualities of 30 (predicted error rate 1:1000) and up are good
- Figure 2 - Histogram showing the number of reads for each sample in the raw data
- Figure 3 - Histogram showing the percent of reads discarded after trimming the adapters (after the removing of the adapters, some read and polyA/T or low quality reads may be too short; the pipeline discards them)
- Figure 4 - Histogram with the number of reads for each sample in each step of the pipeline
- Figure 5 - Plots showing sequence coverage on and near gene regions
- Figure 6 -
- Histogram showing the percent of reads that mapped uniquely and not uniquely per sample
- Histogram showing the percent of the uniquely mapped reads that mapped to genes (genes included must have at least 5 reads)
- Exploratory Analysis
- Figure 7 - Heatmap plotting the highly-expressed genes (above 5% of total expression). For example the expression of gene RN45S in sample SRR3112243 amounts to 15% of the expression
- Figure 8 - Heatmap of Pearson correlation between samples according to the gene expression values
- Figure 9 - Clustering dendogram of the samples according to the gene expression
- Figure 10 - PCA analysis
- Histogram of % explained variability for each PC component
- PCA plot of PC1 vs PC2 c. PCA plot of PC1 vs PC3
- Differential Expression Analysis (this section exists only if you run the DESeq2 analysis) - a table with the number of differentially expressed (DE) genes in each category (up/down) for the different contrasts. In addition, links for p-value distribution, volcano plots and heatmaps, as well as a table of the DE genes with dot plots of their expression values
- Bioinformatics Pipeline Methods - description of the utilized pipeline methods
- Links to additional results - links for downloading tables with raw, normalized counts, log normalized values (rld) and statistical data of contrasts. In the case of model with batches, "combat" values are calculated (instead of rld) using the "sva" package, and are batch corrected normalized log2 count values.
Annotation file:
For the counts of the reads per gene we use with annotation files (gtf format) from "ensemble" or "gencode". In MARS-seq analysis we extend the 3' UTR exon away from the transcript on the DNA and extend or cut the 3" UTR exon towards the 5' direction on the mRNA.
Examples of reports
RNA-Seq example: public data set from Klepikova AV et al. BMC Genomics. 2015 Jun 18;16:466
https://bip.weizmann.ac.il/rna-seq
Mars-seq example: public data set from Feigelson SW et al. Cell Rep. 2018 Jan 23;22(4):849-859
https://bip.weizmann.ac.il/mars-seq
Please regard this analysis as a good starting point and not an end result.
Other pipelines available through UTAP:
See : ATAC-Seq manual
List of links
Transcriptome pipeline:
http://ngspipe.wexac.weizmann.ac.il:7000
Demo of the UTAP interface:
UTAP - User-friendly Transcriptome Analysis Pipeline (for external users)
Acknowledgments
Citation:
Kohen et al. BMC Bioinformatics (2019) 20:154 https://doi.org/10.1186/s12859-019-2728-2 (PMID: 30909881)
Bioinformatics support staff for UTAP:
- UTAP team (UTAP maintenance) utap@weizmann.ac.il
- Dena Leshkowitz
- Ester Feldmesser
- Gil Stelzer
- Bareket Dassa
- Noa Wigoda